Docker
|
Prometheus
-
Notes
See this page for more information: https://docs.docker.com/config/daemon/prometheus/
Prometheus is an open-source systems monitoring. It gathers information from endpoints. You can configure Docker as a Prometheus target. You can only monitor Docker itself. You cannot currently monitor your application using the Docker target.
-
Configure Docker
Docker integration with Prometheus is experimental and not enabled in the dockerd server by default. You need to configure the dockerd server to enabled the experimental features and expose the metrics address. The configuration can be done using the "experimental" and "metrics-addr" options.
The options "--experimental" and "--metrics-addr" can be set on the command line (systemd) when starting the dockerd server (/lib/systemd/system/docker.service).
They can also be put into the "daemon.json" file. The "daemon.json" file can be located in: "/etc/docker/daemon.json". Note that it might not be created by default when you install Docker.
$ vi /etc/docker/daemon.json
daemon.json:
{
  "metrics-addr": "0.0.0.0:9323",
  "experimental": true
}
Restart Docker:
$ sudo service docker restart
Prometheus will connect to the port "9323" to get metrics (a listener will be listening on all addresses on port 9323).
To validate the endpoint:
$ curl -s http://localhost:9323/metrics | head -5
# HELP builder_builds_failed_total Number of failed image builds # TYPE builder_builds_failed_total counter builder_builds_failed_total{reason="build_canceled"} 0 builder_builds_failed_total{reason="build_target_not_reachable_error"} 0 builder_builds_failed_total{reason="command_not_supported_error"} 0 -
Start Prometheus
Copy the following configuration and save it to "/tmp/prometheus.yml":
# my global config
global:
  scrape_interval:     15s # Set the scrape interval to every 15 seconds. Default is every 1 minute.
  evaluation_interval: 15s # Evaluate rules every 15 seconds. The default is every 1 minute.
  # scrape_timeout is set to the global default (10s).

  # Attach these labels to any time series or alerts when communicating with
  # external systems (federation, remote storage, Alertmanager).
  external_labels:
      monitor: 'codelab-monitor'

# Load rules once and periodically evaluate them according to the global 'evaluation_interval'.
rule_files:
  # - "first.rules"
  # - "second.rules"

# A scrape configuration containing exactly one endpoint to scrape:
# Here it's Prometheus itself.
scrape_configs:
  # The job name is added as a label `job=<job_name>` to any timeseries scraped from this config.
  - job_name: 'prometheus'

    # metrics_path defaults to '/metrics'
    # scheme defaults to 'http'.

    static_configs:
      - targets: ['192.168.2.22:9090']

  - job_name: 'docker'
         # metrics_path defaults to '/metrics'
         # scheme defaults to 'http'.

    static_configs:
      - targets: ['192.168.2.22:9323']
Start Prometheus container:
$ docker container run -d -p 9090:9090 -v /tmp/prometheus.yml:/etc/prometheus/prometheus.yml prom/prometheus
-
Use Prometheus
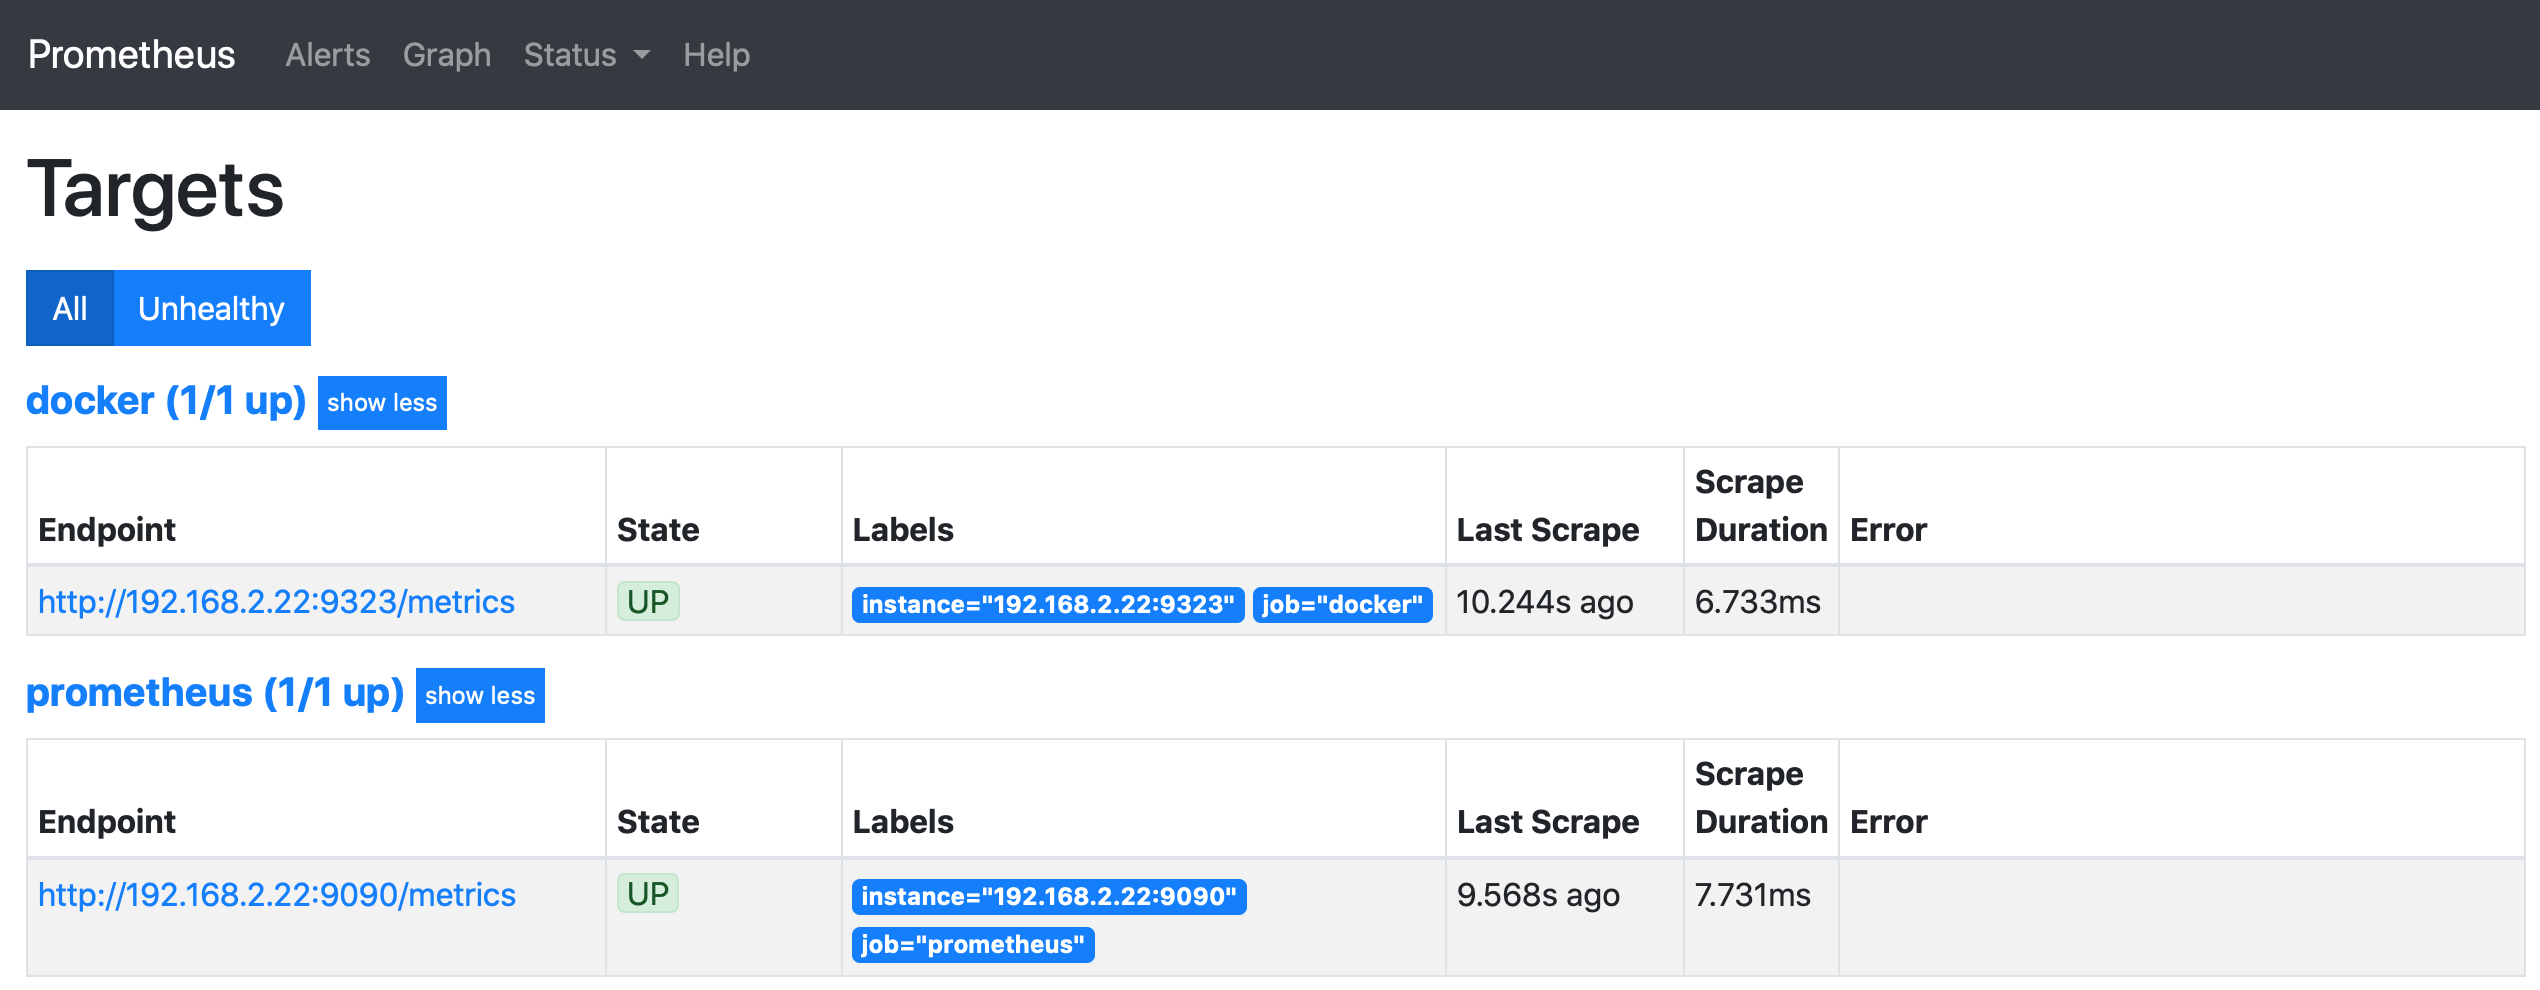
Verify that the Docker target is listed at http://192.168.2.22:9090/targets/:
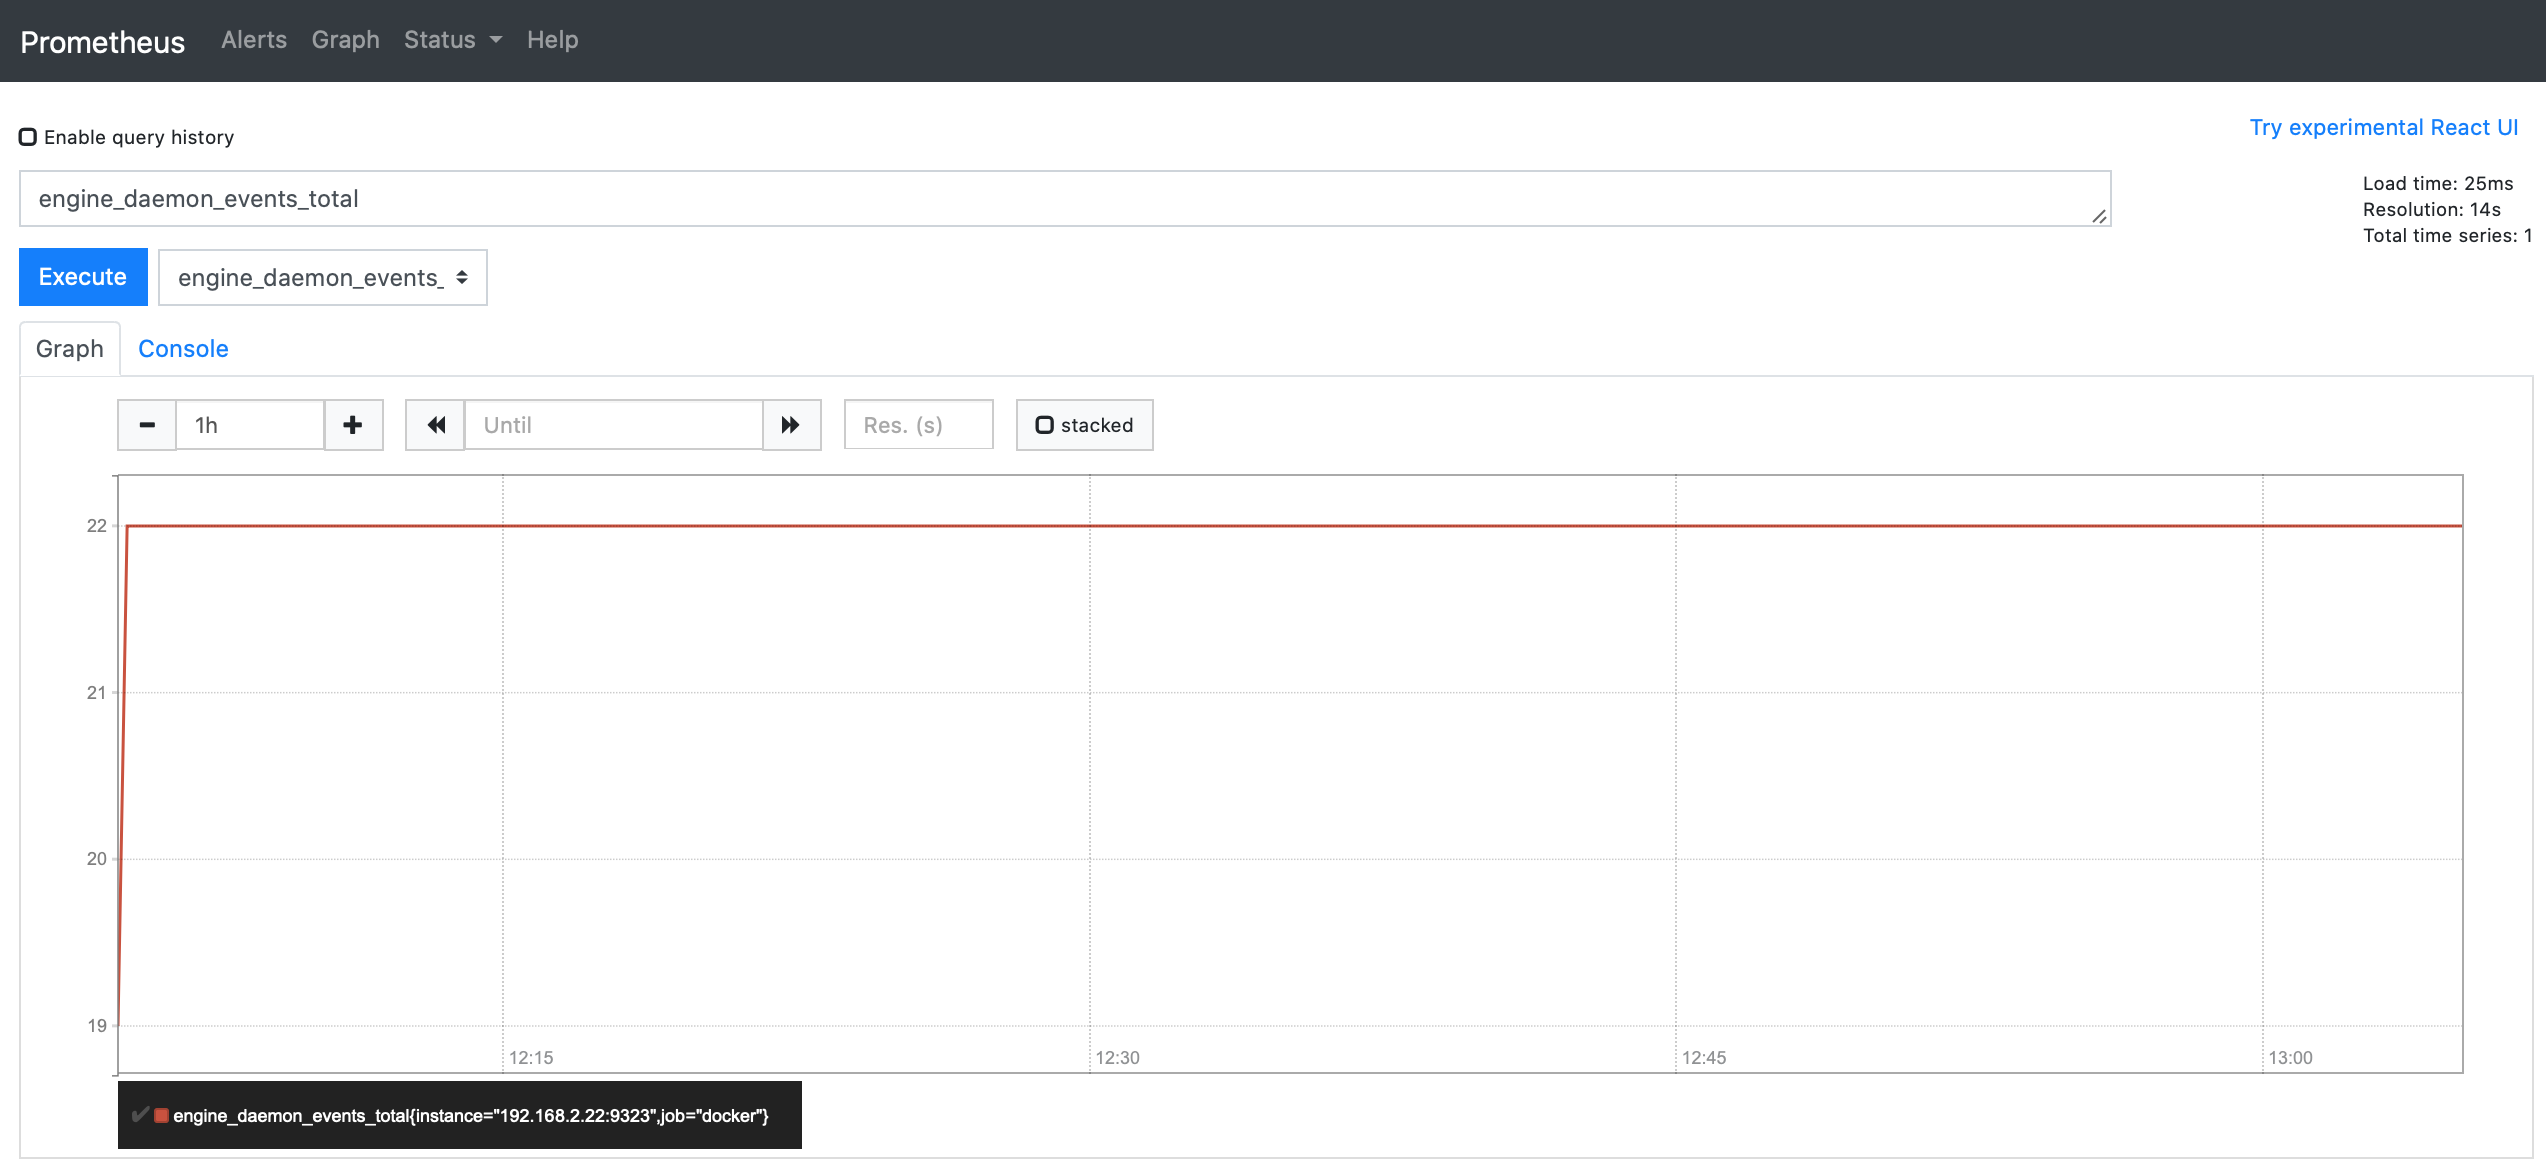
Click on Graph an select a metric and click Execute: http://192.168.2.22:9090/graph