Kubernetes
|
Collect Kubernetes metrics (Minikube's addon: 'metrics-server')
- Verify that 'metrics-server' addon is enabled
- Use Kubernetes Dashboard to visualize metrics
- Metrics API
- Use 'kubectl get' command to query the Metrics API
- Use 'kubectl top' command to display resources usage
- Use 'kubectl describe' command to display the resources allocated to a node
-
Verify that 'metrics-server' addon is enabled
Verify that 'metrics-server' addon is enabled:
$ minikube addons list | grep metrics-server
| metrics-server | minikube | disabled |
Enable metrics-server addon (if disabled):
$ minikube addons enable metrics-server
🌟 The 'metrics-server' addon is enabled
Verify that 'metrics-server' pod is running:
$ kubectl get pods --namespace kube-system | grep metrics-server
metrics-server-7bc6d75975-qwgxt 1/1 Running 0 17s
-
Use Kubernetes Dashboard to visualize metrics
See this page for details on how to configure Minikube dashboard: MiniKube dashboard
-
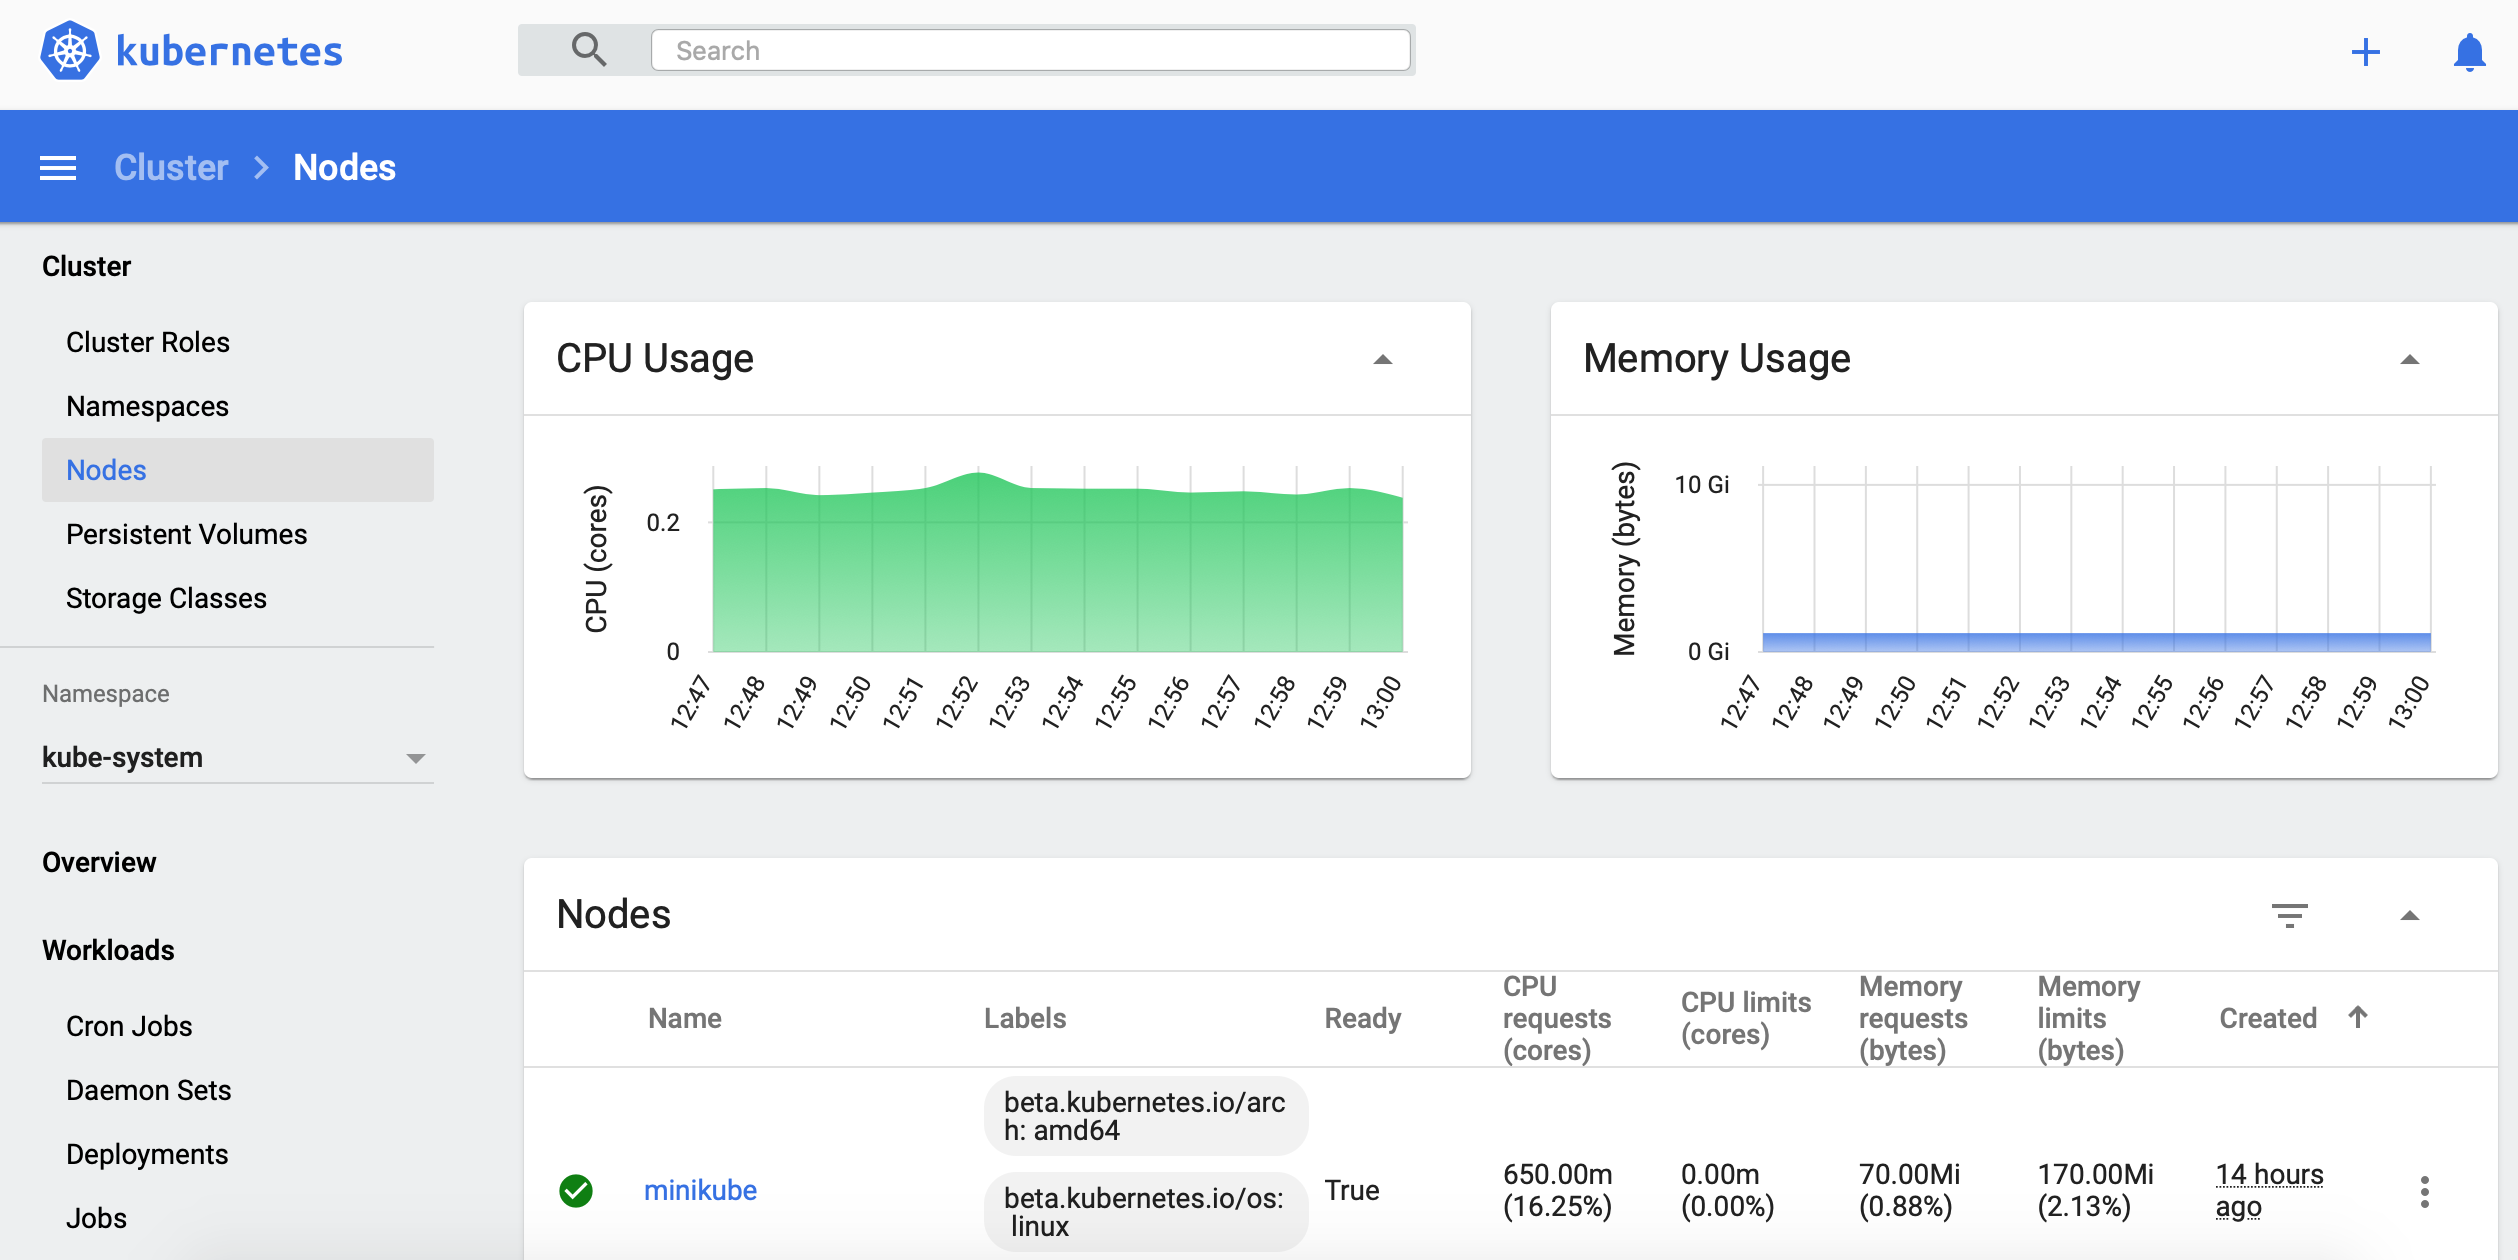
Visualize Nodes metrics
-
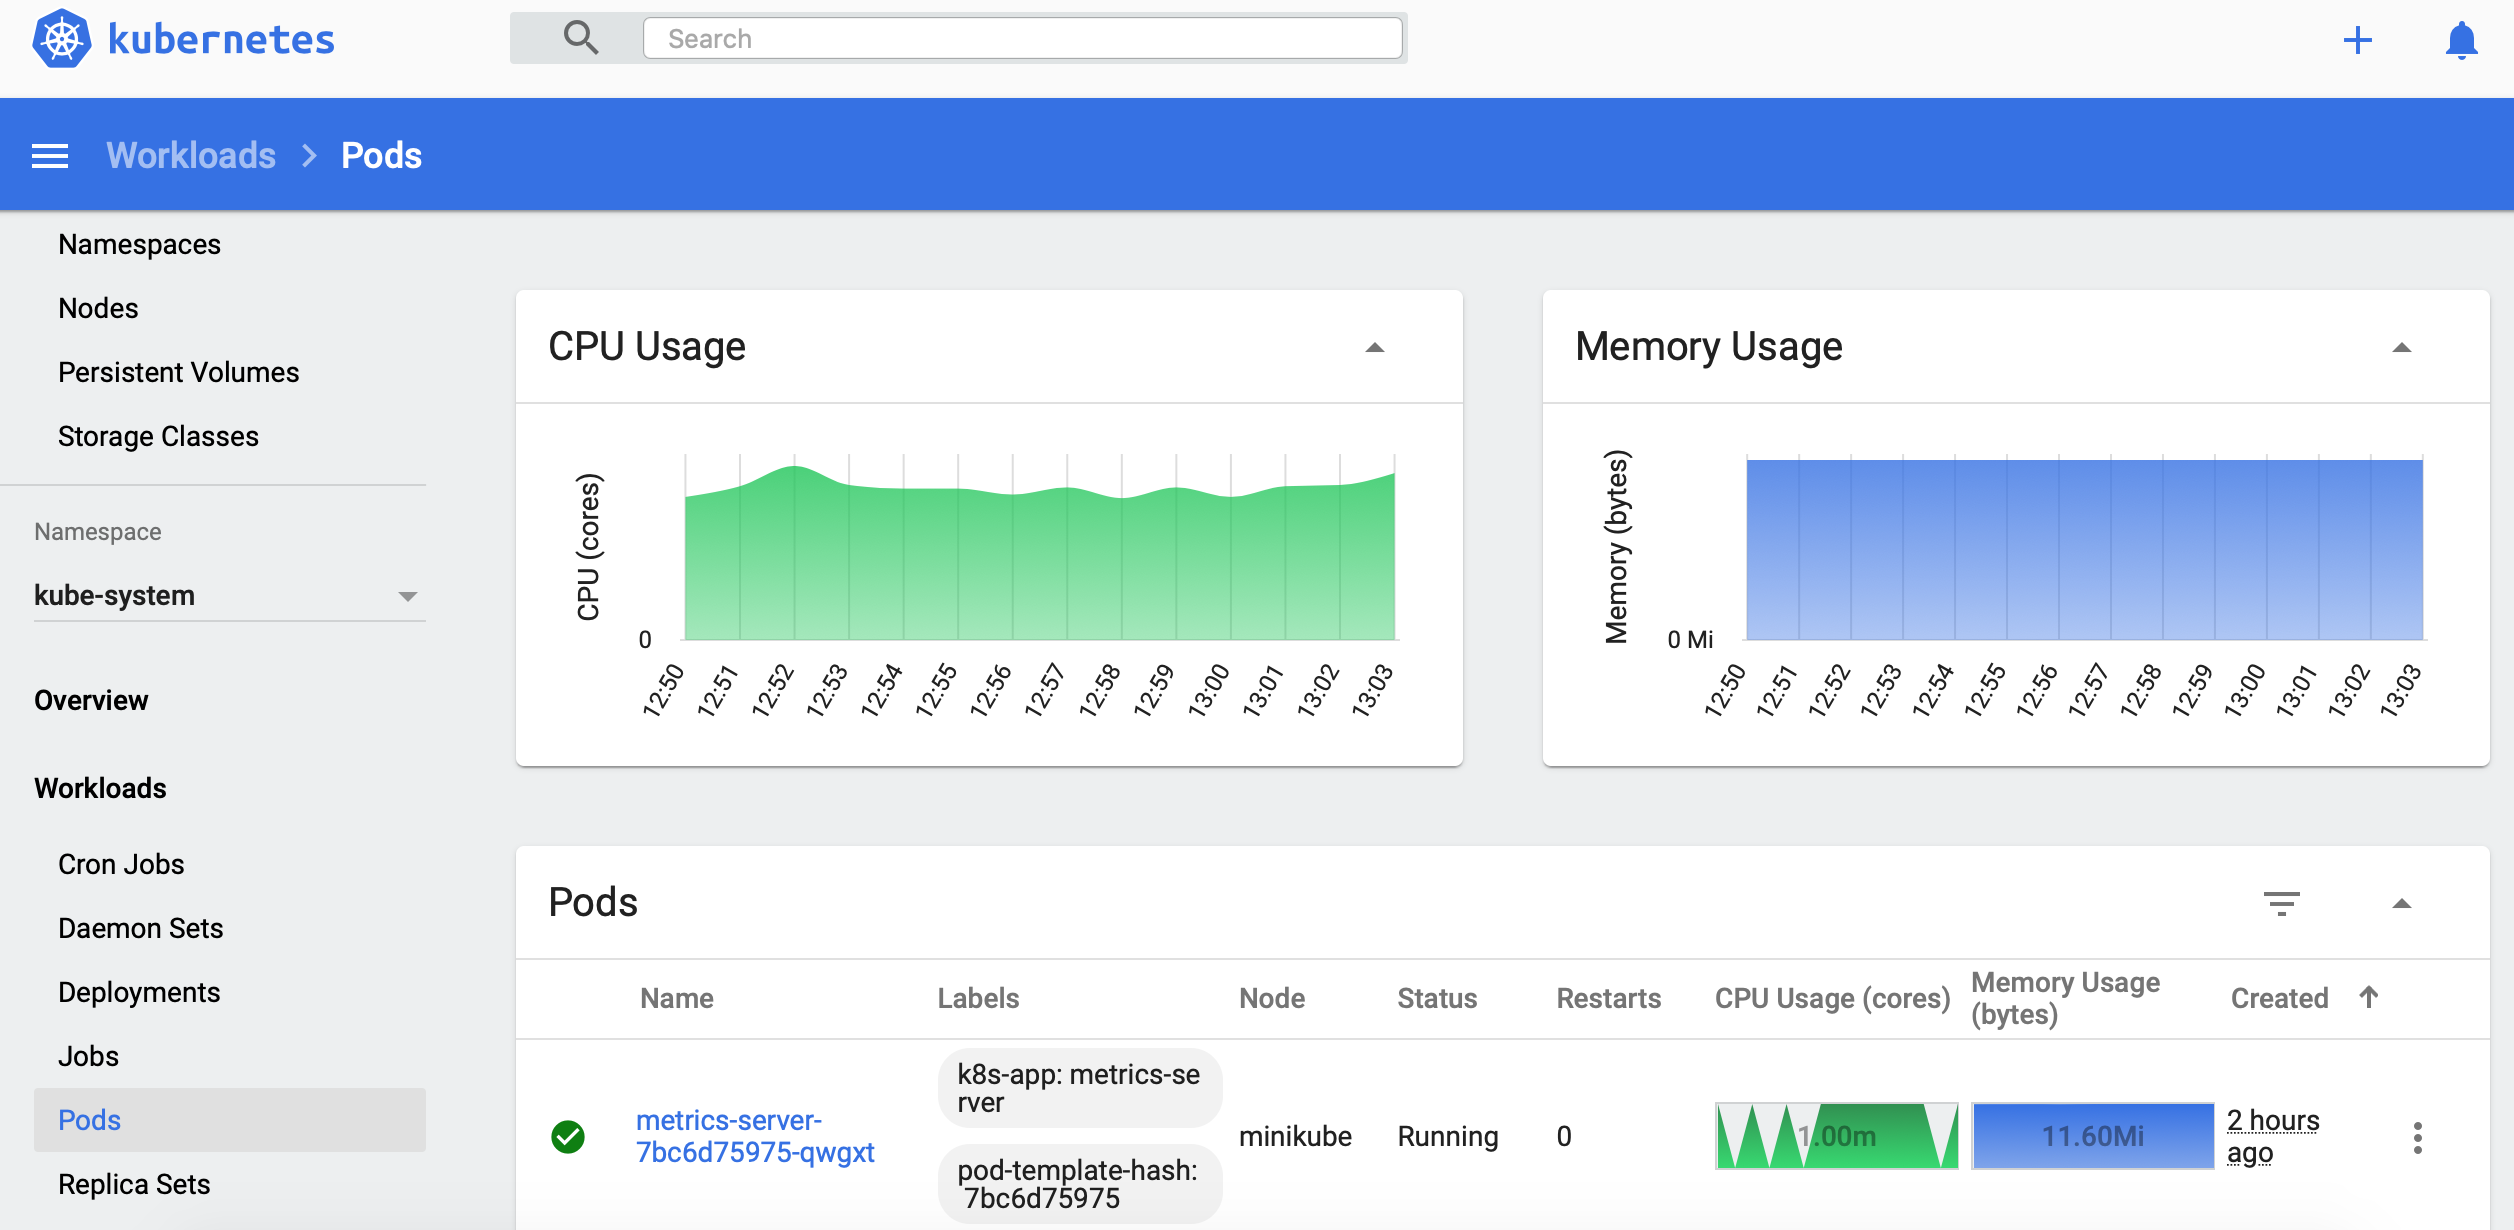
Visualize Pods metrics
-
Visualize Nodes metrics
-
Metrics API
-
Check Metrics API version:
$ kubectl get --raw /apis/metrics.k8s.io/
{ "kind": "APIGroup", "apiVersion": "v1", "name": "metrics.k8s.io", "versions": [ { "groupVersion": "metrics.k8s.io/v1beta1", "version": "v1beta1" } ], "preferredVersion": { "groupVersion": "metrics.k8s.io/v1beta1", "version": "v1beta1" } } -
Check available resources of the Metrics API:
$ kubectl get --raw /apis/metrics.k8s.io/v1beta1
{
  "kind": "APIResourceList",
  "apiVersion": "v1",
  "groupVersion": "metrics.k8s.io/v1beta1",
  "resources": [
    {
      "name": "nodes",
      "singularName": "",
      "namespaced": false,
      "kind": "NodeMetrics",
      "verbs": [
        "get",
        "list"
      ]
    },
    {
      "name": "pods",
      "singularName": "",
      "namespaced": true,
      "kind": "PodMetrics",
      "verbs": [
        "get",
        "list"
      ]
    }
  ]
}
-
Check Metrics API version:
-
Use 'kubectl get' command to query the Metrics API
-
Node metrics:
To print node metrics, use the following command:
kubectl get --raw /apis/metrics.k8s.io/v1beta1/nodes/<NODE_NAME>
List existing nodes:
$ kubectl get nodes
NAME       STATUS   ROLES    AGE   VERSION
minikube   Ready    master   17h   v1.18.3
Print Node metrics:
$ kubectl get --raw /apis/metrics.k8s.io/v1beta1/nodes/minikube
{ "kind": "NodeMetrics", "apiVersion": "metrics.k8s.io/v1beta1", "metadata": { "name": "minikube", "selfLink": "/apis/metrics.k8s.io/v1beta1/nodes/minikube", "creationTimestamp": "19:29:54" }, "timestamp": "19:29:00", "window": "1m0s", "usage": { "cpu": "239m", "memory": "1209836Ki" } } -
Pod metrics:
To print pod metrics, use the following command:
kubectl get --raw /apis/metrics.k8s.io/v1beta1/namespaces/<NAMESPACE>/pods/<Pod_NAME>
List existing Pods:
$ kubectl get pods --namespace kube-system | grep metrics-server
NAME                               READY   STATUS    RESTARTS   AGE
metrics-server-7bc6d75975-qwgxt    1/1     Running   0          3h29m
Print Pod metrics:
$ kubectl get --raw /apis/metrics.k8s.io/v1beta1/namespaces/kube-system/pods/metrics-server-7bc6d75975-qwgxt
{
  "kind": "PodMetrics",
  "apiVersion": "metrics.k8s.io/v1beta1",
  "metadata": {
    "name": "metrics-server-7bc6d75975-qwgxt",
    "namespace": "kube-system",
    "selfLink": "/apis/metrics.k8s.io/v1beta1/namespaces/kube-system/pods/metrics-server-7bc6d75975-qwgxt",
    "creationTimestamp": "17:46:57"
  },
  "timestamp": "17:46:00",
  "window": "1m0s",
  "containers": [
    {
      "name": "metrics-server",
      "usage": {
        "cpu": "0",
        "memory": "11992Ki"
      }
    }
  ]
}
-
Node metrics:
-
Use 'kubectl top' command to display resources usage
-
Print 'kubectl top' command help:
$ kubectl top --help
Display Resource (CPU/Memory/Storage) usage.

 The top command allows you to see the resource consumption for nodes or pods.

 This command requires Metrics Server to be correctly configured and working on the server.

Available Commands:
  node        Display Resource (CPU/Memory/Storage) usage of nodes
  pod         Display Resource (CPU/Memory/Storage) usage of pods

Usage:
  kubectl top [flags] [options]
-
Print Node resources usage:
$ kubectl top node minikube
NAME       CPU(cores)   CPU%   MEMORY(bytes)   MEMORY%
minikube   256m         6%     1156Mi          14%
You can use the following command to display resources of all nodes:
kubectl top node
-
Print Pod resources usage:
$ kubectl top kube-system pod metrics-server-7bc6d75975-qwgxt --namespace
NAME                              CPU(cores)   MEMORY(bytes)
metrics-server-7bc6d75975-qwgxt   1m           11Mi
You can use the following command to display resources of all pods:
kubectl top --namespace kube-system
You can use the option --containers to display resources of all containers of a pod:
kubectl top pod metrics-server-7bc6d75975-qwgxt --containers --namespace kube-system
-
Print 'kubectl top' command help:
-
Use 'kubectl describe' command to display the resources allocated to a node
-
Print Node information:
$ kubectl describe node minikube
Name:               minikube
Conditions:
  Type             Status  Reason                       Message
  ----             ------  ------                       -------
  MemoryPressure   False   KubeletHasSufficientMemory   kubelet has sufficient memory available
  DiskPressure     False   KubeletHasNoDiskPressure     kubelet has no disk pressure
  PIDPressure      False   KubeletHasSufficientPID      kubelet has sufficient PID available
  Ready            True    KubeletReady                 kubelet is posting ready status
Capacity:
  cpu:                4
  ephemeral-storage:  9107004Ki
  hugepages-2Mi:      0
  memory:             8161508Ki
  pods:               110
Allocatable:
  cpu:                4
  ephemeral-storage:  9107004Ki
  hugepages-2Mi:      0
  memory:             8161508Ki
  pods:               110
Non-terminated Pods:          (10 in total)
  Namespace                   Name                                         CPU Requests  CPU Limits  Memory Requests  Memory Limits  AGE
  ---------                   ----                                         ------------  ----------  ---------------  -------------  ---
  kube-system                 coredns-66bff467f8-d5tdc                     100m (2%)     0 (0%)      70Mi (0%)        170Mi (2%)     15h
  kube-system                 etcd-minikube                                0 (0%)        0 (0%)      0 (0%)           0 (0%)         15h
  kube-system                 kube-apiserver-minikube                      250m (6%)     0 (0%)      0 (0%)           0 (0%)         15h
  kube-system                 kube-controller-manager-minikube             200m (5%)     0 (0%)      0 (0%)           0 (0%)         15h
  kube-system                 kube-proxy-zzpnf                             0 (0%)        0 (0%)      0 (0%)           0 (0%)         15h
  kube-system                 kube-scheduler-minikube                      100m (2%)     0 (0%)      0 (0%)           0 (0%)         15h
  kube-system                 metrics-server-7bc6d75975-qwgxt              0 (0%)        0 (0%)      0 (0%)           0 (0%)         3h46m
  kube-system                 storage-provisioner                          0 (0%)        0 (0%)      0 (0%)           0 (0%)         15h
  kubernetes-dashboard        dashboard-metrics-scraper-dc6947fbf-46l94    0 (0%)        0 (0%)      0 (0%)           0 (0%)         14h
  kubernetes-dashboard        kubernetes-dashboard-6dbb54fd95-fqqzm        0 (0%)        0 (0%)      0 (0%)           0 (0%)         14h
Allocated resources:
  (Total limits may be over 100 percent, i.e., overcommitted.)
  Resource           Requests    Limits
  --------           --------    ------
  cpu                650m (16%)  0 (0%)
  memory             70Mi (0%)   170Mi (2%)
  ephemeral-storage  0 (0%)      0 (0%)
  hugepages-2Mi      0 (0%)      0 (0%)
-
Print Node information: